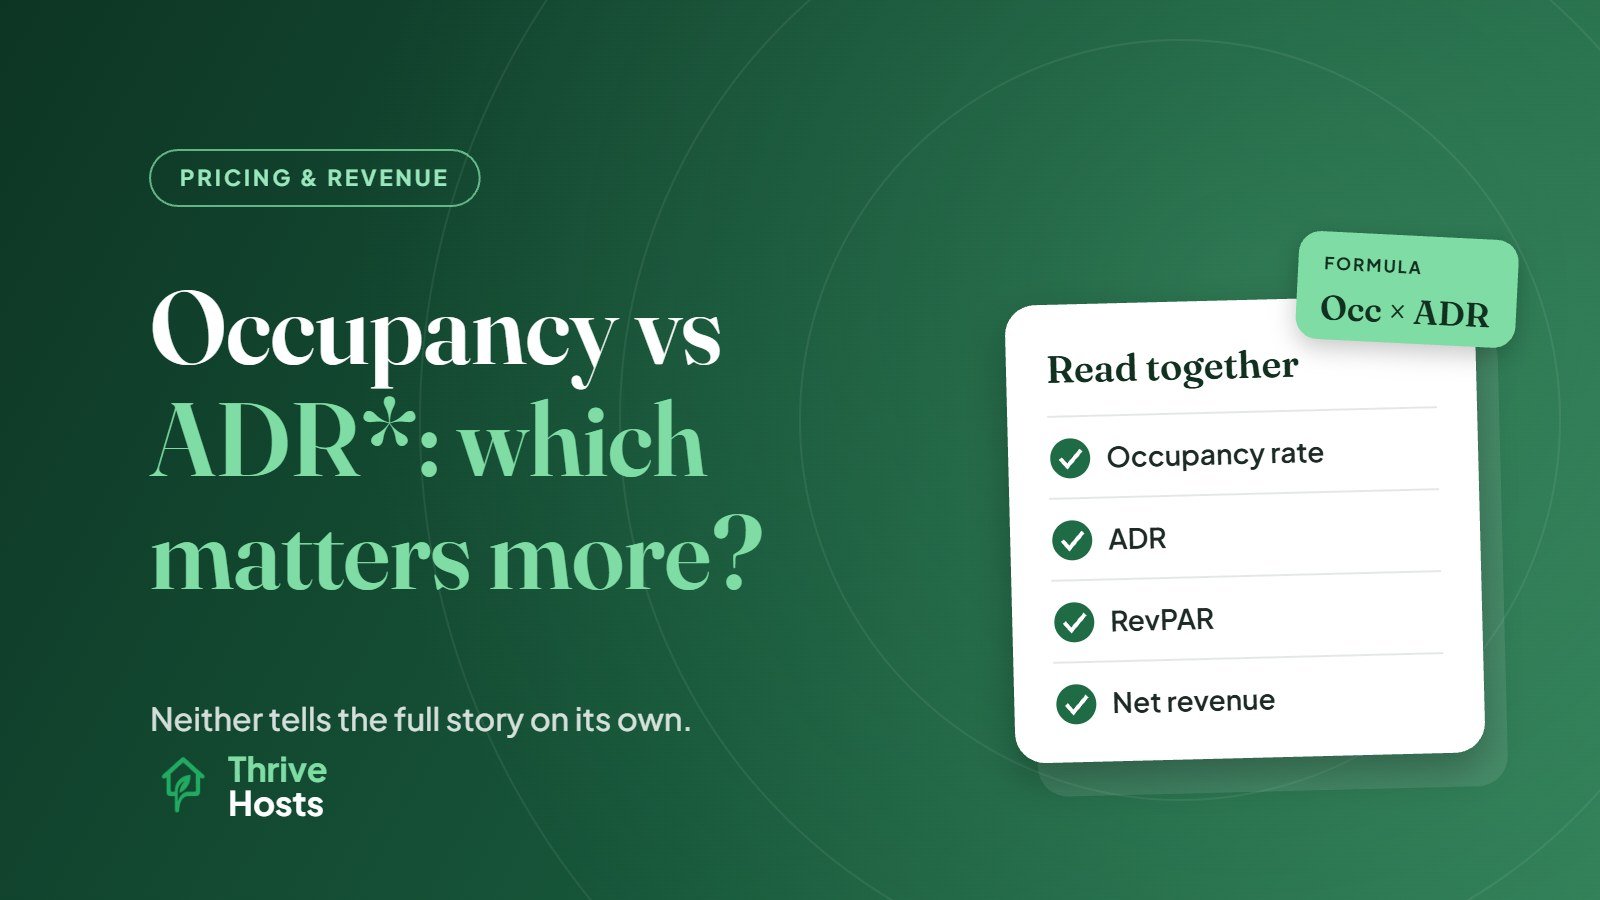
Neither occupancy nor ADR matters more on its own. Occupancy tells you how many available nights were booked; ADR (average daily rate) tells you how much you earned per booked night. Revenue depends on both, which is why most revenue managers look at them together, usually through RevPAR (revenue per available night), and then check what is left after per-stay costs.
The useful question is not which metric is more important, but which one is holding your property back right now.
You can run both numbers for your own property with the occupancy rate calculator and see how they combine in the RevPAR calculator.
What each metric measures
Occupancy rate is the number of nights booked divided by the number of nights available. If your property was available for 30 nights in a month and 21 were booked, occupancy was 70%. Be consistent about what counts as available; owner stays and blocked maintenance nights are usually excluded.
ADR is your rental revenue divided by the number of booked nights. If those 21 nights brought in 3,150 in rental revenue, ADR was 150. Decide whether you include cleaning fees and be consistent; many operators exclude them so ADR reflects the nightly rate. Our guide to ADR for short-term rentals covers the calculation in more depth.
RevPAR combines the two: occupancy multiplied by ADR, or total rental revenue divided by available nights. In the example above, that is 70% × 150, or 105 per available night.
Why looking at one metric misleads
A property with 95% occupancy might look like a success. But if it reached that level by pricing well below the market, it could be earning less than a neighbor at 70% occupancy with a much higher ADR. The busy property also carries more cleaning costs, more wear and more guest communication.
The reverse is also true. A host proud of a high ADR may be holding rates so firmly that most nights go unbooked. A few expensive stays do not make up for a mostly empty calendar.
Here is a simple comparison over a 30-night month:
- Property A: 90% occupancy (27 nights) at an ADR of 120 = 3,240 revenue
- Property B: 70% occupancy (21 nights) at an ADR of 165 = 3,465 revenue
Property B earns more while hosting six fewer nights. If each turnover costs money in cleaning and supplies, and Property A also has more check-ins to manage, the gap in net revenue widens further. We look at this in more detail in why high occupancy does not always mean higher revenue.
When to focus on occupancy
Occupancy deserves more attention when:
- Your listing is new and needs bookings and reviews to build momentum
- You are in a low season where demand is genuinely thin
- Your fixed costs are high and you need reliable baseline income
- Comparable listings are booking far more of the same dates than you are
In these cases, the priority is usually filling nights that would otherwise go empty, often through pricing adjustments closer to the date, more flexible stay rules or a more competitive base rate.
When to focus on ADR
ADR deserves more attention when:
- Your calendar fills quickly, especially far in advance
- Peak dates and events are booking at your normal rate
- Your occupancy is consistently higher than comparable listings
- Turnover costs and workload are eating into profit
These are signs that guests would likely pay more. Raising rates on high-demand dates, tightening discounts and reviewing minimum stays for peak periods can all lift ADR without necessarily hurting total revenue.
Look at the net result
Revenue is not the same as profit. Once you have occupancy, ADR and RevPAR, subtract per-stay costs such as cleaning, laundry, consumables and platform fees. This is where the occupancy versus ADR question becomes concrete. Two strategies with similar RevPAR can produce different net results because one involves far more turnovers.
Track trends, not snapshots
A single month’s figures can be misleading because of seasonality, events and booking patterns. Compare each period with the same period last year where possible, and watch the direction of travel. Rising occupancy with falling ADR might mean you are underpricing. Falling occupancy with stable ADR might point to a listing or visibility problem rather than price.
Used together, occupancy and ADR tell you whether your pricing is too cautious, too aggressive or about right. Used alone, either one can push you in the wrong direction.
Want clearer revenue reporting?
Thrive Hosts tracks occupancy, ADR and revenue for STR owners remotely and uses those numbers to guide pricing and calendar decisions. You get a clear view of performance and keep control of the strategy.
Explore Pricing & Revenue Support
Bruce J is the CEO of Thrive Hosts and leads the short-term rental team. He works on the operations and performance side of STR: guest communication, pricing and calendar discipline, turnovers, issue tracking and owner reporting across Airbnb, Vrbo and Booking.com. On the blog he writes practical, no-fluff guides for owners and operators who want their rentals to run more consistently.