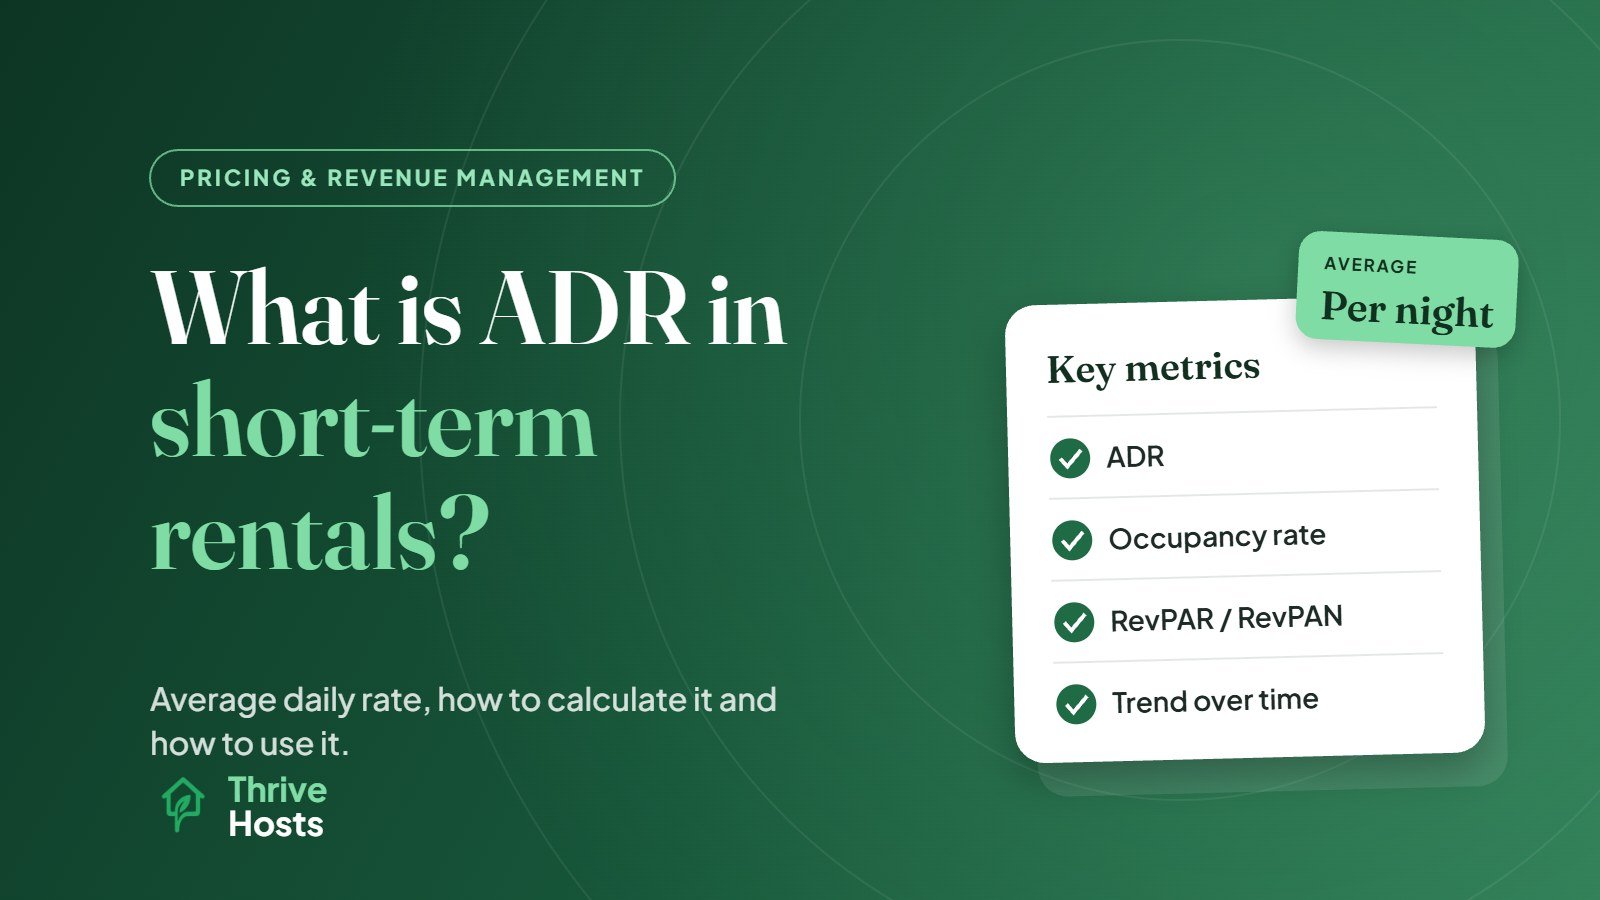
ADR stands for average daily rate. In short-term rentals it is the average amount you earn per booked night over a given period. You calculate it by dividing your rental revenue by the number of nights that were actually booked. It tells you what guests are paying for the nights you sell, which is different from the nightly rate you advertise.
ADR comes from the hotel industry, where it is one of the standard performance measures, and it has become just as common in short-term rental reporting, pricing tools and market data.
To check your own figure, the free ADR calculator works out average daily rate from booking revenue and booked nights, with cleaning fees taken out.
How to Calculate ADR
The formula is simple:
ADR = rental revenue ÷ number of booked nights
Say your property earned 6,300 in nightly rental revenue in June from 21 booked nights. Your ADR for June is 6,300 ÷ 21 = 300.
Notice what is not in the calculation: the 9 unbooked nights. ADR only looks at the nights you sold. That is why it needs to be read alongside occupancy, which tells you how many nights you sold out of those available.
What to Include in Revenue
This is where ADR comparisons often go wrong. Different hosts, software and data providers define revenue differently. Some include cleaning fees, some exclude them. Some use the amount the guest paid, others the host payout after platform fees. Taxes are normally excluded.
There is no single right answer, but there is a right habit: pick one definition and use it consistently. If you include cleaning fees in March, include them in April. And when you compare your ADR with a market report or a pricing tool, check how that source defines it before drawing conclusions. A difference of a few percent might be nothing more than a different definition.
Many hosts find it most useful to track ADR on nightly rental revenue only, excluding cleaning fees and taxes, because that reflects what the pricing strategy itself is achieving.
ADR, Occupancy and Revenue per Available Night
ADR on its own can be misleading. A host could raise ADR easily by pricing high and accepting a nearly empty calendar. Another could fill every night at a low rate and have high occupancy but weak earnings. Neither tells the whole story.
That is why ADR is usually paired with two other figures:
- Occupancy rate: booked nights ÷ available nights. In the example above, 21 ÷ 30 = 70%.
- Revenue per available night: revenue ÷ available nights, which is the same as ADR × occupancy. In the example, 300 × 70% = 210. Hotels call this RevPAR; in short-term rentals you will also see RevPAN or RevPAR.
Revenue per available night combines both price and occupancy, so it is often the best single measure of how well your pricing is working. If your ADR rises but occupancy falls by more, you have earned less overall.
How to Use ADR in Practice
ADR is most useful as a trend and a comparison, not as a number to chase. A few practical uses:
Comparing periods
Compare ADR for the same month across years to see whether your pricing is keeping pace with the market. Comparing June with January tells you about seasonality, not performance.
Checking pricing decisions
If you raised rates for summer, ADR shows whether guests actually paid the higher rates or whether discounts and last-minute drops pulled the average back down.
Spotting discount leakage
When your advertised rates look healthy but ADR is consistently lower, the gap often comes from weekly and monthly discounts, last-minute reductions, promotions or long stays at reduced rates. That is not necessarily bad, but you should know it is happening.
Benchmarking
Comparing your ADR with similar properties in your market can show whether you are priced above or below the competition. Just make sure the comparison set is genuinely similar in size, location, quality and amenities.
Common ADR Mistakes
- Chasing ADR alone. A higher ADR is not a win if occupancy falls far enough to reduce total revenue.
- Mixing definitions. Including cleaning fees one month and not the next makes trends meaningless.
- Comparing across seasons. ADR naturally rises in peak season and falls in off-peak periods.
- Ignoring stay length. Longer stays often come with discounts that lower ADR, but they also mean fewer turnovers and lower cleaning costs.
What a Good ADR Looks Like
There is no universal good ADR. It depends entirely on your market, property type, size, quality and season. The better question is whether your ADR and occupancy together are producing the revenue the property should earn, and whether that is improving over time. Our guides on dynamic pricing for short-term rentals and how often to change Airbnb prices cover how to manage the pricing side.
Getting Clear Performance Reporting
Many owners never see their ADR, occupancy and revenue per available night in one place, which makes it hard to judge whether pricing is working. Thrive Hosts provides owner reporting alongside pricing and calendar management as part of remote short-term rental operations support, so you can see how each property is performing and why.
You keep control of your listings, accounts and pricing decisions. We give you the numbers and the context behind them.
Explore pricing and revenue support
We will look at your recent ADR, occupancy and revenue trends and show you where your pricing strategy may be leaving money on the table.
Explore Pricing & Revenue Support
Bruce J is the CEO of Thrive Hosts and leads the short-term rental team. He works on the operations and performance side of STR: guest communication, pricing and calendar discipline, turnovers, issue tracking and owner reporting across Airbnb, Vrbo and Booking.com. On the blog he writes practical, no-fluff guides for owners and operators who want their rentals to run more consistently.